|
|
|
|
     |
|
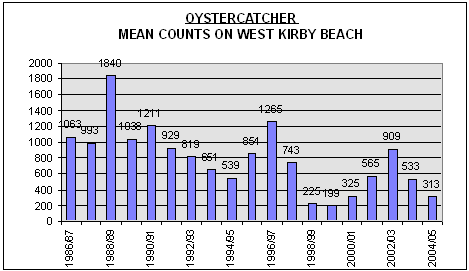
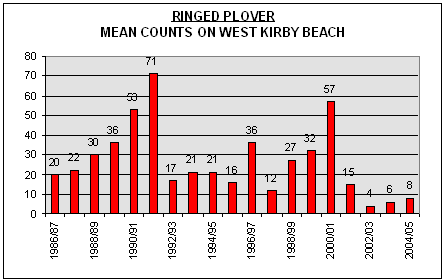
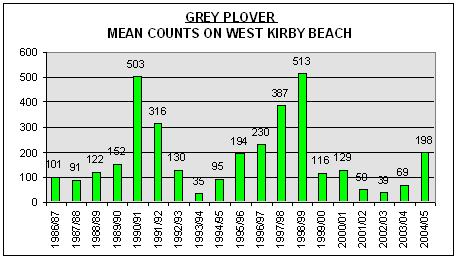
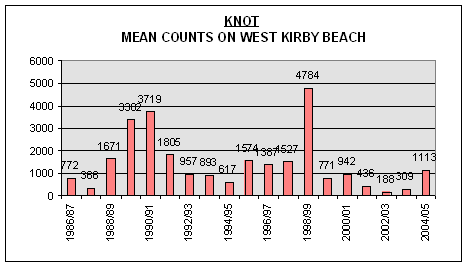
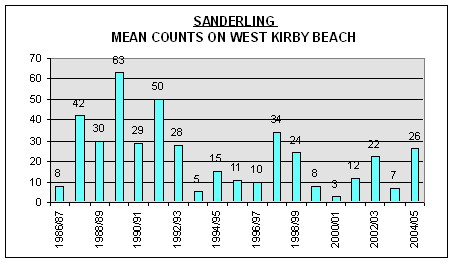
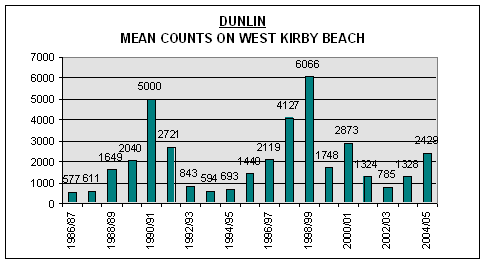
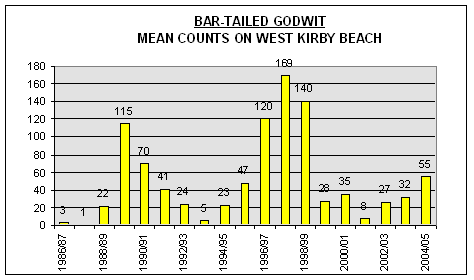
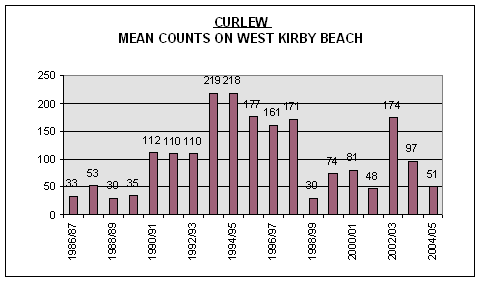
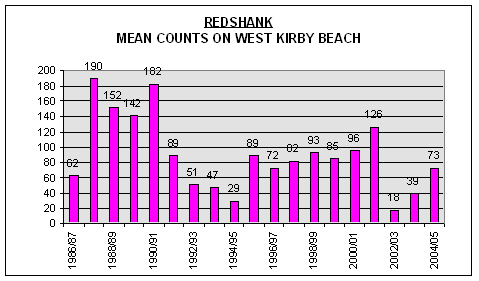
Graphs showing mean numbers of nine species of waders each year from 1986/87 to 2004/2005. |
|
|
|
The nine graphs below show how the mean numbers of the nine species of waders commonly found at the West Kirby Shore high tide roost have varied over the past 19 winters. The mean for a particular winter is calculated by adding each daily count for each species, then simply dividing by the number of days the birds were counted (during the winter of 2004/2005 the Dee Estuary Voluntary Wardens were present on 96 days).
Graphs copyright © Dee Estuary Voluntary Wardens. Many thanks to Roy Palmer for compiling the graphs using data gathered over the years by the Dee Estuary Voluntary Wardens. |